


Note: Excerpts taken from Eckhardt Optics
As part of a recent project, I wanted to get a better fundamental understanding of surface roughness when discussing plastic injection molded optics. There are several standards that can be used to reference surface roughness, and each is appropriate in a given industry. However all of the specifications ultimately refer back to ISO 4287, part 1 & 2, for definitions of terms and measurement methods.
Surface measurement is typically divided into three regions; roughness, waviness, and form.
- Roughness – a range from the minimum the instrument can measure, up to ~80um
- Waviness – 80um to 1mm
- Form – any feature that extends more than 1mm
For specifying surface roughness to a company that specializes in optics, the appropriate standard is ISO10110, part 8: “Surface Texture”. This standard allows for simplification of the typical surface roughness standard. A “G” above the basic symbol specifies a ground surface. A “P” followed by a number between 1 and 4 specifies a polished surface. The number calls out the allowable number of micro-defects per 10mm length, with 1 specifying less than 400, and 4 specifying less than 3.
For plastic optics, it is possible to use the simple specifications published by the Society for the Plastics Industry. Of these, SPI A-1, which specifies polishing with 6000 grit diamond, is the only one worth considering for optically smooth surfaces.
TIS(Rq)
For optical systems, the fact that rough surfaces scatter light is the main reason for concern about surface roughness.
Bennett and Porteus came up with the concept of Total Integrated Scatter (TIS), the total amount of light scattered by a surface – and found a functional relationship between TIS & surface roughness (JOSA 51, 123 – Relation Between Surface Roughness and Specular Reflection at Normal Incidence), which was later extend to refraction and non-normal incidence angles.
The equation that describes the functional relationship between optical scattering and surface roughness is shown below:

R0 is the theoretical reflectance of the surface. Rq is the RMS roughness of the surface. Θi is the angle of incidence. Lambda is the wavelength of the light.
- Optical scattering is proportional to reflectance (surfaces intended to reflect light will inherently scatter more light than transmissive surfaces).
- Scatter is related to Rq and not one of the other measures of scatter.
- Shorter wavelengths will scatter more than longer wavelengths.
- More light scatters at normal incidence than grazing incidence.
Note: For a typical surface, Rq is approximately 1.4X Ra, because Rq weighs the larger deviations more heavily. Bigger scratches scatter mroe light, so they should be weighed more heavily. Using Rq simply reflects this updated weight.
Below is a plot showing TIS with R0=1, Lambda = 500nm, and Θ=60 degrees.
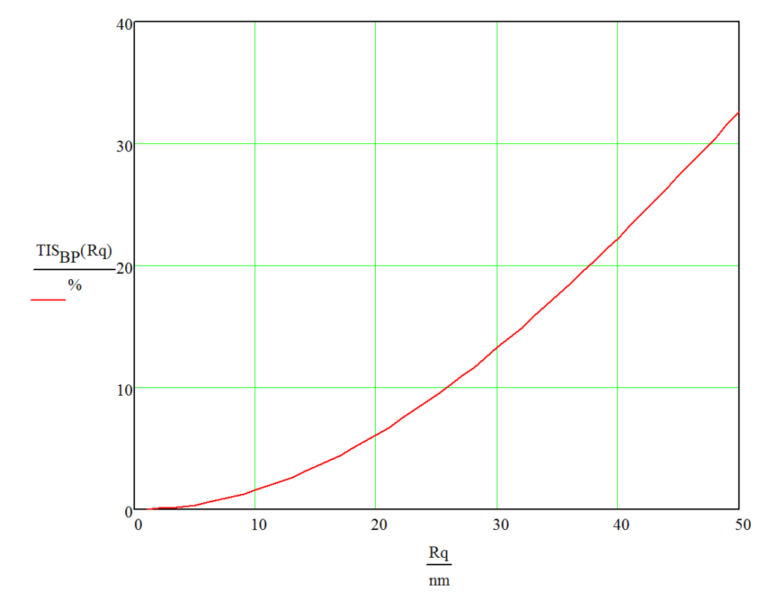
Scatter vs Rq
A surface with Rq=25nm scatters about 10% of the light. Dropping Rq down to about 17nm cuts the scatter in half. It is important to note that R0=1 for the above plot, and transmitting surfaces will have scatter that is only about 4% of this.
At the other end of the roughness spectrum, commercially polished glass has an Rq of 1.2nm, so scatter is well under 1%. Super polished surfaces can achieve Rq=0-.1 to 0.2nm. That’s about 1-2 atoms!
Single point diamond turned surfaces can achieve Rq=5nm, and sometimes down to 3nm – this is about as tight a spec as one could place on a molded plastic option. A loose spec would be SPI A-1. The Society for the Plastics Industry (SPI) has a range of specifications for the finish of molds for plastic, and A-1 is the smoothest. The specification calls for Ra between 12.5nm to 25nm.
Given that the measure of Ra (about 0.7 * Rq), and the surface could be as ro ugh as 25nm (35nm Rq), this is a very loose tolerance for optical surfaces.
SPI Mold Finishes
SPI A1 = 25nm (Rq) = 35nm (Rq)
SPI A2 = 50nm (Ra) = 70nm (Rq)
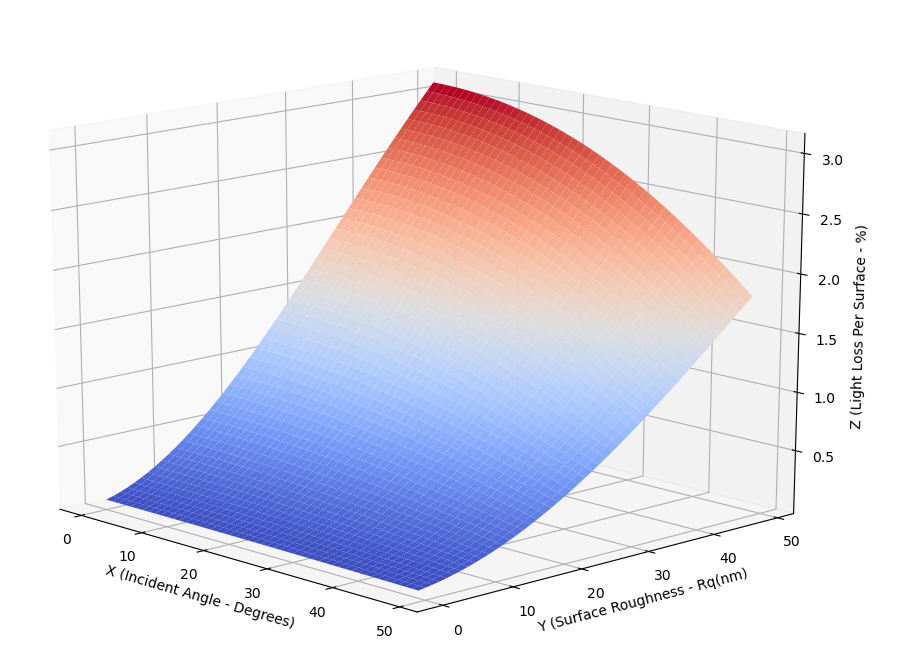
With all of that being said, I am personally a visual learner. I truly appreciate python for allowing me to plot mathematical models to edit variables in real-time, and see how those changes drive relationships in equations.
Below is a plot that shows Optical Loss v Incident Angle v Surface roughness, for polymethyl methacrylate, at a standard red wavelength (lambda = 690nm).
import matplotlib.pyplot as plt
import math
import numpy as np

def max_crit_angle(nd_1, nd_2):
   if nd_1 < nd_2:
      print("Error: no critical angle because material 1 has a lower index of refraction than material 2")
   else:
      crit_angle_rad = int(round(math.acos(nd_2/nd_1), 2))
      crit_angle_deg = int(round(math.acos(nd_2/nd_1) * 180/math.pi, 2))
      return(crit_angle_rad, crit_angle_deg)

def generate_rq_list(rq_start, rq_end):
   rq_list = []
   for rq in range(rq_start, rq_end, 1):
      rq_list.append(rq*1e-9)
   return(rq_list)

def surface_plot (matrix, **kwargs):
   # acquire the cartesian coordinate matrices from the matrix
   # x is cols, y is rows
   (x, y) = np.meshgrid(np.arange(matrix.shape[0]), np.arange(matrix.shape[1]))
   fig = plt.figure()
   ax = fig.add_subplot(111, projection='3d')
   surf = ax.plot_surface(x, y, matrix*100, **kwargs)
   return (fig, ax, surf)


r0 = .05  # Material base reflectivity at 0 degree incident angle
lamda_red = .000000690  # Red wavelength
lamda_ir = .000000900  # IR wavelength
nd_material1 = 1.491  # Polymethyl methacrylate
nd_material2 = 1.0  # Air
rq = 20E-9  # surface roughness
rq_start = 5
rq_end = 55

max_critical_angle_rad, max_critical_angle_deg = max_crit_angle(nd_material1, nd_material2)
incident_angles = np.linspace(0, max_critical_angle_deg, num=50)
rq_list = generate_rq_list(rq_start, rq_end)
data_array = np.zeros(shape=(len(rq_list), len(incident_angles)))

for rq in range(0, len(rq_list)):
   tis_rq_list = []
   for angle in range(0, len(incident_angles)):
      TIS_rq = r0 * (1 - np.exp(-(4*np.pi*rq_list[rq]*math.cos(np.deg2rad(incident_angles[angle]))/lamda_red)**2))
      tis_rq_list.append(TIS_rq)
      data_array[rq][angle] = TIS_rq

(fig, ax, surf) = surface_plot(data_array, cmap=plt.cm.coolwarm)
ax.set_xlabel('X (Incident Angle - Degrees)')
ax.set_ylabel('Y (Surface Roughness - Rq(nm)')
ax.set_zlabel('Z (Light Loss Per Surface - %)')
plt.show()
